| |
Abstract (English) |
1 |
| |
|
|
Introduction |
With regard to the introduction of a SwissDRG system in Switzerland,
the question arises how well such patient classification system
would represent paediatric cases.
Against this background,
appropriate methods for the analysis of DRG systems
and for the suggestion of
improvements were being sought. |
2 |
Data |
Data covering 21,194 cases in 2005 were available of eight children's
hospitals and paediatric
departments of
acute hospitals, combined in the
«DRG work group» of the
«Swiss Paediatric Society» (SGP).
The data sets comprised APDRG codes, age,
length of stay and partly also
LEP times
(LEP® = Workload Measurement in Nursing).
For this study, 20,436 data sets could be used
(of which 15,344 with LEP times).
Altogether,
445 APDRGs were occupied.
Out of them, there were 124 APDRGs with
30 or more paediatric cases.
Additionally, reference could be made to overall Swiss
data issued by the
«Federal Statistical Office» (FSO, in German: BFS)
of 2003 and 2004,
with more than 800,000
faultlessly grouped cases
from acute hospitals and
paediatric clinics. |
3 |
Methods |
To obtain an overview of these data,
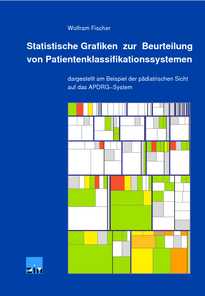
a spoke plot as well
as treemaps
comprising the case proportions per DRG were compiled.
As a demonstration of homogeneity,
the spread of care days and LEP times
were visualised by box plots
and multiple density diagrams.
The DRG key figures, that is, case weight,
expected length of stay
and trim points were recalculated
on the basis of
the SGP's data and compared with the standard values provided
by the APDRG-Switzerland association (APDRG-CH). In this, the technique of
«difference diagrams»
developed by the author was used. |
4 |
| |
The 124 selected APDRGs were furthermore checked on whether
paediatric age splits on the basis of the SGP's data could
be suggested. To this end, each APDRG was divided as per the
following age groups: 0–10 days, 11–28 days, 29 days
– 1 year, 1–3 years, 3–6 years, 6–10
years, 10–14 years, 14–18 years. For an assessment of
the age splits,
the proportions of explained spread
with regard to length of stay
and LEP times were calculated.
A list of assessment values was compiled,
on the basis of which the candidates for analysis were determined.
For an assessment of these DRGs,
one page was programmed with various diagrams
and a semi-automated comment was provided. |
5 |
Results |
This study introduces methods,
by means of which DRG homogeneity can be examined
and ways of suggesting improvements can be found.
Numerous APDRGs with significant spread were
detected.
(Some of them should be examined more closely as
candidates for systematic age splits.) In case of many APDRGs
which are already split by «age below 18 years»,
the values for expected length of stay and case weight
calculated on the basis of the SGP's data
were above the APDRG-CH values. |
6 |
Conclusions |
The results indicate that it is necessary to examine both the
DRG key figures (such as length of stay and case weight)
and homogeneity of the DRGs from a paediatric point of view.
In this, the diagrammed evaluations
– the treemaps,
difference diagrams and multiple box plots,
in particular –,
help gain a survey of the existing data
and also indicate in
which areas there is a need for action. The question is to be
asked whether any further criteria other than the existing ones
used for the DRG classification are to be sought to achieve a
sensible paediatric APDRG refinement. |
7 |
Prospects |
Refinement of a DRG system is not the only possibility to achieve
a more adequate reimbursement.
Modular systems might turn out to be not
only more appropriate but could also
be more transparent than continuously refined DRG systems. |
8 |
 fulltext
(2.1 MB)
 Grafiken zur PCS-Beurteilung (Zusammenfassung)
 Graphiques pour évaluer des PCS (Résumé)
 Grafikaĵoj por prijuĝi PKS-ojn (Koncizigo)