Fischer: A Comparison of Australian National Cost Weights from 1997/98 until 1999/00.

Z I M - Paper 18th PCS/E Innsbruck       Oct. 2002
Last update: 09.08.2002


A Comparison of
Australian National Cost Weights
From 1997/98 Until 1999/00

Wolfram Fischer*
Martin Schumann+
Max J. Lenz+

*Zentrum für Informatik und wirtschaftliche Medizin, Wolfertswil
+LENZ, Zürich


Navigation
 î  ZIM home
 î  navigation tables
 î  sitemap
 î  abbreviations
English Papers
^ index
<   Nursing Workload and DRGs
>   Base DRGs, Fractionation Coefficient, and Treemaps
Related Links
»   Are DRGs Homogeneous?
»   Cost Weight Proportions
»   DRG Family
Related Links 2
»    PCS-Tabellen
»   (deutsche Version)   Deutscher Text

Table of Contents


1 ABSTRACT


2 Introduction


3 Material


4 Method


5 Results


5.1 Analysis of the whole cost volume


5.2 Analysis by types of sub-MDCs


5.3 Analysis according to AR-DRGs


6 Discussion


7 Conclusions


8 REFERENCES


|^·<×>·v|

1

ABSTRACT

INTRODUCTION

In this study, we present indicators to evaluate the evolution and the instability of cost weights (CWs). They are applied to the Australian national cost data.

MATERIAL

We used the national hospital cost data collections of Australia from the years 1997/1998, 1998/1999 and 1999/2000 which were available on the internet.

METHODS

We defined coefficients for the analysis of the instability and evolution of CWs. As a third figure, the average change of the cost volume in Australian dollars is used.

RESULTS

From 1998/1999 to 1999/2000, the Australian cost volume belonging to AR-DRGs with increasing costs had risen by AUD +294 million, and the cost volume belonging to DRGs with decreasing costs had decreased by AUD -205 million. This corresponds to 3.2 %, and –2.2 %, respectively, of the total of the cost volume which amounted to AUD 9,244 million.

We found 53 unstable AR-DRGs with an average yearly change of CW which amounted to more than 15 %. The CWs of another 14 AR-DRGs have risen every year by an average of more than 15 %; the CWs of 21 AR-DRGs sank more than 15 % in the yearly average. With 36 unstable AR-DRGs, the average sum of the cost differences was more than AUD 2.5 million per DRG. With another 44 AR-DRG the reduction of the cost volume over two years was more than AUD -2.5 million. And the cost volume of 52 AR-DRGs rose by more than AUD 2.5 million.

DISCUSSION

To discover possible reasons for those striking variations of CWs, we made lists with several questions not yet answered. It will be necessary to do research into the environmental conditions (more outpatient treatment, medical innovation), into the methodological aspects (changes in the number of patients of the samples, small numbers of patients per DRG, methods of the cost calculation), and also into the DRG system itself (changes in the coding or grouping systems, lack of clinical homogeneity of DRGs, imprecise case definitions).

CONCLUSIONS

The results of this study point out that it can be difficult to get stable cost weights over several years for DRGs which are not homogeneous from the economic and/or the clinical perspective.

According to the causes of the variations of cost weights, different approaches will be necessary to obtain solutions: changes in the conditions which are set by the contractors, changes in the processes within hospitals, and changes in the design of the DRG system in use.


|^·<×>·v|

2

Introduction

1 Vgl. Fischer [DRG-Systeme, 2000]: 134-137 und Fischer [APDRG-LEP, 2001].

How stable are cost weights?

The question as to the cost-related homogeneity of DRGs1 also raises the question as to the stability of cost weight calculations. If cost weights (CWs) are exposed to arbitrary change over the years, this will increase the financial risks of the contractors who fix prices on this basis. The risk for smaller hospitals will grow since the amount of numbers of cases is often inversely proportionate to the effectiveness of statistical balance.

2 Fischer et al. [CW-AR4, 2002].

About this text

This text presents characteristic figures for the assessment of the evolution and instability of cost weights on the basis of the national cost data of Australia. It is based on a detailed study, which the authors presented to the 3rd German Casemix Conference in March 2002.2


|^·<×>·v|

3

Material

3 National Hospital Cost Data Collection: http:// www.health.gov.au / casemix / costing / costmain1.htm.


The study is based on the overall Australian cost data, which are available on the Internet and refer to surveys conducted for 1997/98, 1998/99 and 1998/99.3 From among these data, the authors use the cost weights and the number of cases per DRG and year. The present cost weights are relative average case costs of about 75 % of public hospitals.


|^·<×>·v|

4

Method

Example data

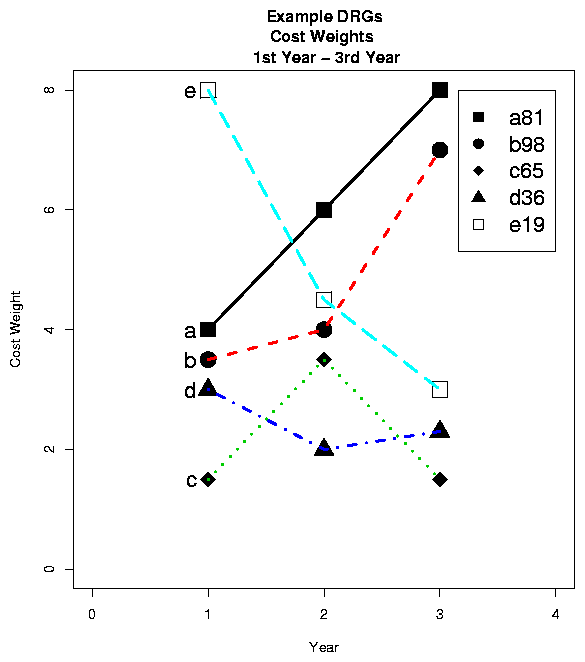
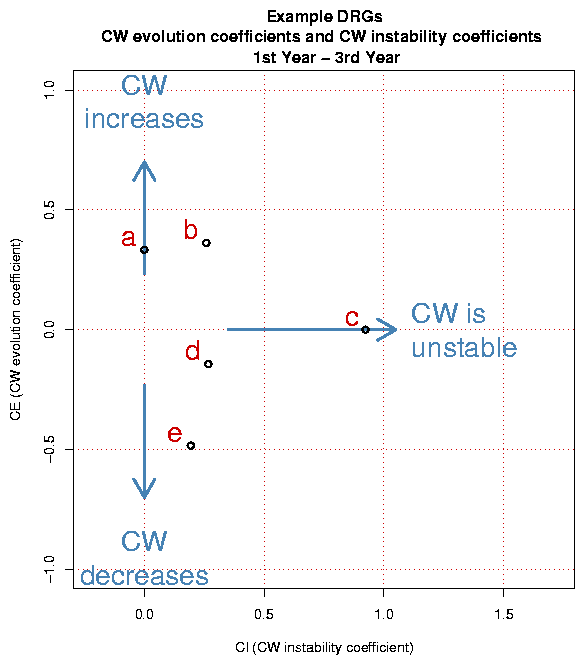
To explain the method that was developed, the authors generated an exemplary data set. [Tables 1 and 2]

Table 1:
Beispiel-DRGs

DRG a b c d e
DRG-code a81 b98 c65 d36 e19
Label Constant increase of CW Reinforcing increase of CW Return to inital CW Fluctations of CW Strong reduction of CW
Sub-MDC S S M M M
CW0 4.0 3.5 1.5 3.0 8.0
CW1 6.0 4.0 3.5 2.0 4.5
CW2 8.0 7.0 1.5 2.3 3.0
NC0 1'500 2'000 1'800 1'100 1'000
NC1 1'300 2'400 1'800 1'300 1'300
NC2 1'100 2'800 1'800 1'200 1'600


Legende zu Table 1:
CW0 Kosten­gewicht im ersten Jahr
NC1 An­zahl Fälle im zweiten Jahr

Table 2:
Test example: cost weights

Table 2: Test example: cost weights


Source: Z I M.

Cost weight differences

For analytical purposes, the first elements to be calculated were the differences of cost weights per DRG and for the two consecutive years.

«CW instability» and «CW evolution»

The stability of cost weight evolution increases with the similarity of the behaviour of the two cost weight differences. Conversely, opposing or completely different cost weight evolutions are an indication of instability. On the basis of these considerations, two coefficients were developed for this study: a «CW instability coefficient» and a «CW evolution coefficient».

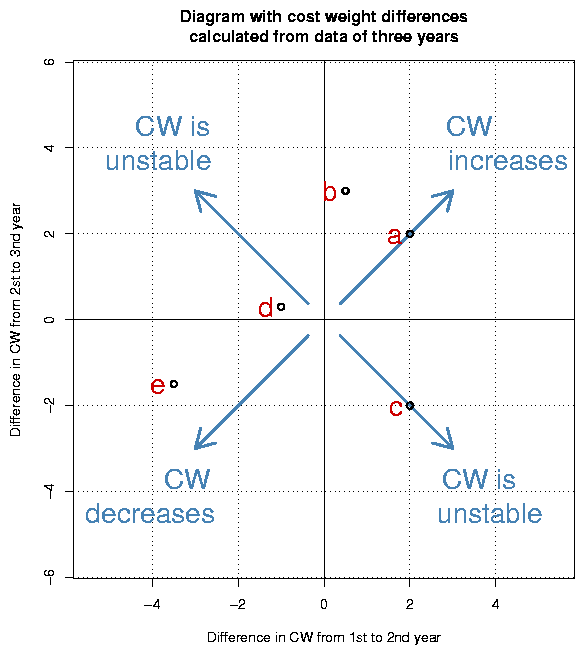
When the two cost weight differences are represented on the x-axis and the y-axis [Table 3, left], those DRGs which display the same cost weight difference both times are situated on the diagonal from bottom left to top right. The distance of the DRG positions from the zero point in the direction of the diagonal indicates how strongly the cost weight increases or decreases («evolves»). On the other diagonal, which is at right angles to the first, we find those DRGs whose first cost difference was offset by the second cost difference. Thus the cost weights of these DRGs are unstable.

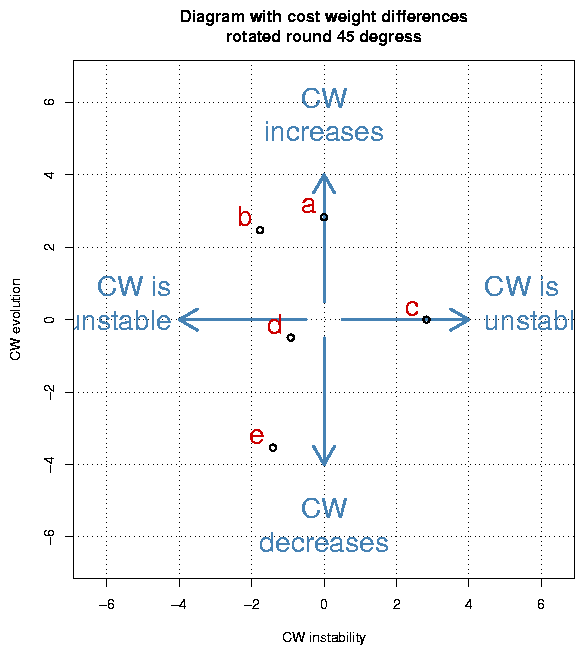
When the coordinate system that was used to represent the cost weight differences is rotated round 45 degrees counter-clockwise, then the upper half will contain DRGs with increasing cost weights and the lower half will contain DRGs with decreasing cost weights. Both in the left and in the right half, we will find DRGs with unstable cost weights. [Table 3, right]

Table 3:
– Diagram with cost weight differences calculated from data of three years
– Diagram with cost weight differences rotated round 45°

Table 3a: Schema mit Kostengewichtdifferenzen von drei Berechnungsjahren Table 3b: Schema mit Kostengewichtdifferenzen um 45° rotiert
 

Source: Z I M.


The extent of CW change, i. e. CW evolution, was now related to the average cost weight.

CW evolution coefficient (CE)

The «CW evolution coefficient» (CE) is calculated as a mean value of the cost weight differences divided by the mean value of the cost weights. – A CW evolution coefficient of 0.5 indicates that the average annual increase of the cost weight was 50 % of the average cost weight during the period of time under observation; a coefficient of –0.3 indicates that the average annual decrease of the cost weight amounted to 30 % of the average cost weight. [Table 4, right]

CW instability coefficient (CI)

The «CW instability coefficient» (CI) was calculated on the basis of the changes in cost differences. It results from the division of the absolute amount of the difference between the cost weight differences by the average cost weight. The CW instability coefficient is always greater than or equals zero. – A CW instability coefficient of 0.7 indicates that the average annual difference between cost weight differences amounted to 70 % of the average cost weight. [Table 4, right]

Reductions in cost volume (NegU)

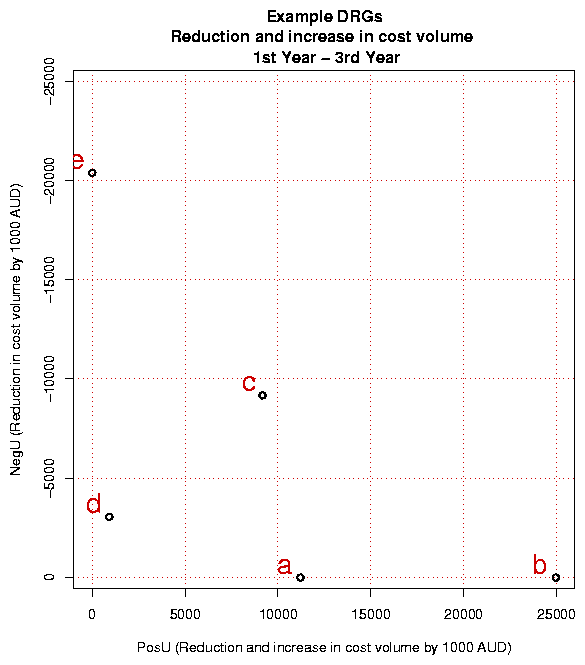
The sum-total of all the CW reductions, multiplied by the latest numbers of cases and average case costs, results in the «reduction in cost volume» throughout the period of time under observation. [Table 4, left]

Increases in cost volume (PosU)

The sum-total of all the CW increases, multiplied by the latest numbers of cases and average case costs, results in the «increase in cost volume» throughout the period under observation. [Table 4, left]


The multiplication of the latest numbers of cases by the latest average costs ensured that the analysis of hospital costs discussed in this study was influenced neither by changes in volume (fluctuations in production) nor by overall economic changes in costs, such as changes caused by inflation.

Table 4:
– Reduction and increase in cost volume for example DRGs
– CW evolution coefficients and CW instability coefficients for example DRGs

Table 4a: Reduction and increase in cost volume for example DRGs Table 4b: CW evolution coefficients and CW instability coefficients for example DRGs
 

Source: Z I M.


|^·<×>·v|

5

Results

|^·<×>·v|

5.1

Analysis of the whole cost volume

4 Regression yielded good results in this respect: the coefficient of determination R2 of the cost weights (weighted with numbers of cases) amounted to 0.983 in the regression from 1998/99 to 1997/98, 0.993 in the regression from 1999/00 to 1998/99 and 0.979. in the regression from 1999/00 to 1997/98.

Statistical balance

A general overview reveals that the cost volumes of consecutive years do not differ excessively.4 This also means that with the method that was used to calculate cost weights, individual changes are, overall, balanced in statistical terms.

The cost volume of the survey for 1999/00 amounted to AUD 9,244 Mio.. The sum-total of reductions in cost volume amounted to –2.2 %, the sum-total of increases to 3.2 %. (The comparative data from the survey for 1998/99, weighted with the numbers of cases and average costs of 1999/00, are these: AUD 9,154 Mio., –2.8 % and 3.3 %.)

CW evolution
and CW instability
(CE and CI)

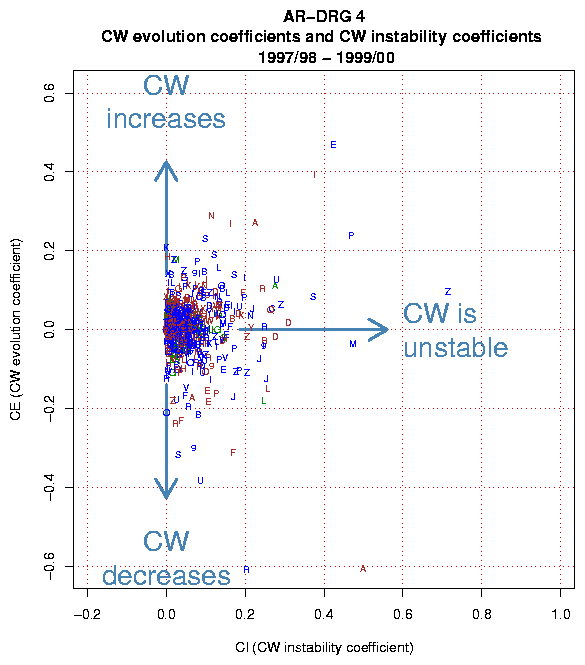
When CW evolution and CW instability are represented, this reveals that a large part of AR-DRGs are situated in the centre of the diagram, i. e. do not display any excessive fluctuations or tendencies towards change [Table 5]. A sizeable quota of AR-DRGs shows evolution coefficients and/or instability coefficients in excess of 10 % (CI > 0.1): in the course of the years under observation, the average CW instability coefficient CI of 112 AR-DRGs exceeds a threshold value of 0.1. [Cf. Table 6.]

Table 5:
CW evolution coefficients and CW instability coefficients for the years of 1997/98 to 1999/00

Table 5: CW evolution coefficients and CW instability coefficients for the years of 1997/98 to 1999/00


Source: Z I M.


Table 6 reveals the number of AR-DRGs which exceed the differently placed threshold values for CI and CE. The threshold values at 15 % and 30 % have been printed bold.

Threshold values
for CI and CE

In this study, AR-DRGs with a CI value in excess of 0.15 (15 %) are considered to be "unstable". AR-DRGs with CIs above 0.30 are described as "particularly unstable". Moreover, if the evolution coefficient CE exceeds 0.15, we speak of "AR-DRGs with distinctly increasing cost weights", whereas AR-DRGs with CEs over 0.30 are "AR-DRGs with particularly strongly increasing cost weights". In analogy, CEs below -0.15 result in "AR-DRGs with distinctly decreasing cost weights", whilst CEs under -0.30 reveal "AR-DRGs with particularly strongly decreasing cost weights".

Table 6:
Number of AR-DRGs according to instability and evolution intensity

Threshold value
for CI and CE
in %
of average CW
CI
CW instability coefficient
Number of AR-DRGs
with CI > threshold value
CW is unstable
CE
CW evolution coefficient
Number of AR-DRGs
with CE < (–threshold value)
CW is decreasing
CE
CW evolution coefficient
Number of AR-DRGs
with CE > threshold value
CW is increasing
50 % 1 2 0
40 % 5 2 1
30 % 8 5 2
25 % 16 6 5
20 % 30 10 8
15 % 53 21 14
10 % 112 39 42
5 % 289 91 160
0 % 649 240 394
= 0 12 27 27


|^·<×>·v|

5.2

Analysis by types of sub-MDCs

Surgical and medical DRGs

DRGs can also be looked at as divided according to "sub-MDC types". In this manner, the key figures of treatment with surgical operations can be compared with those of conservative ("medical") treatment.


Cost increases are higher in surgical AR-DRGs (surgical: 3.9 %; medical: 2.4 %), and reductions are distinctly lower than in medical DRGs (surgical: –1.3 %; medical: –3 %). [Table 7]

Table 7:
Cost volumes and their changes in the survey for 1999/00

  Volume of costs in Mio. AUD Reduction in the volume of costs in % Increase in the volume of costs in %
Medical DRGs 4,795 –3 % 2.4 %
Surgical DRGs 3,965 –1.3 % 3.9 %
Other DRGs 484 –1.5 % 4.9 %
All DRGs 9,244 –2.2 % 3.2 %


CW evolution
and CW instability
(CE and CI)

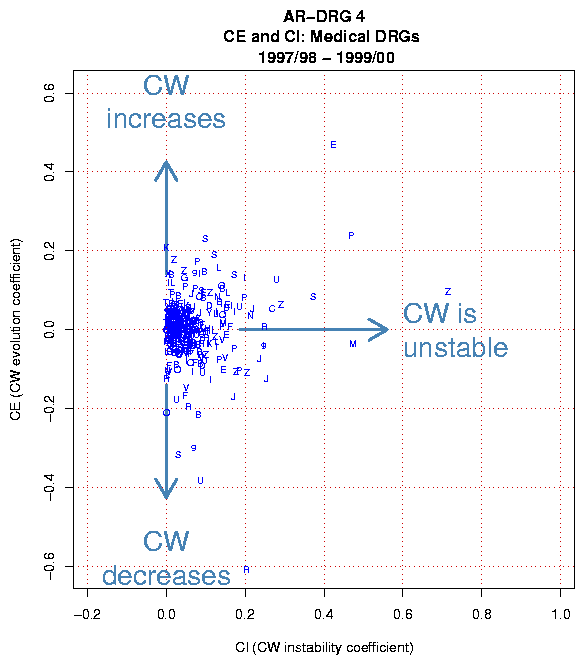
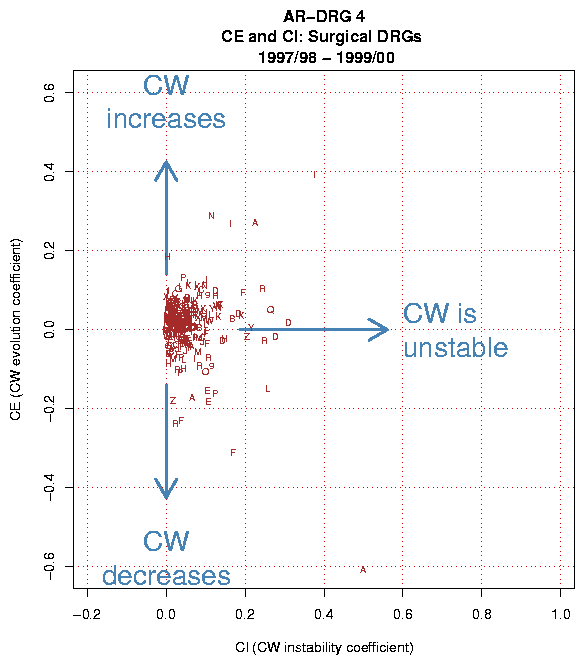
Table 8 displays the evolution and instability coefficients of AR-DRG cost weights according to sub-MDC types. The "swarm of bees" is slightly larger for medical AR-DRGs [left] than for surgical AR-DRGs [right]. This means that medical AR-DRGs are more strongly affected by CW change.


The centre of the "swarm of bees" of surgical AR-DRGs is situated slightly higher up than that of medical AR-DRGs. This means that surgical AR-DRGs show an increased tendency towards higher costs.

Table 8:
– CE and CI of medical AR-DRGs for the year of 1997/98 to 1999/00
– CE and CI of surgical AR-DRGs for the year of 1997/98 to 1999/00

Table 8a: CE and CI of medical AR-DRGs for the year of 1997/98 to 1999/00 Table 8b: CE and CI of surgical AR-DRGs for the year of 1997/98 to 1999/00
 

Source: Z I M.


|^·<×>·v|

5.3

Analysis according to AR-DRGs


Table 9 lists the most unstable AR-DRGs (CI > 0.30). Table 10 displays AR-DRGs with cost weights that increase particularly strongly (CE > 0.25). Table 11 contains the AR-DRGs with cost weights that decrease particularly strongly (CE < -0.25). Table 12 lists AR-DRGs with extremely strong reductions in cost volume (NegU < AUD 7.5 Mio.), Table 13 AR-DRGs with extremely strong increases in cost volume (PosU > AUD 7.5 Mio.).

Table 9:
Results of selected, particularly unstable AR-DRGs (8 AR-DRGs with CI > 0.30)

  . Bezeich­nung base group Split NC2 CW0 CW1 CW2 CI    CE     NegU  PosU
A Pre MDC
A02Z S Multiple Organs Transplant - 14 51.92 19.55 16.37 0.50 –0.61 –1,268  
D Ear, Nose, Mouth, and Throat
D02B S Head and Neck Procedures W/O CC 658 1.60 1.17 1.65 0.31 0.02 –721 804
E Respiratory System
E72Z S Respiratory Problems Arising from Neonatal Period - 400 1.50 1.60 3.59 0.42 0.47   2,129
I Musculoskeletal System and Connective Tissue
I21Z S Local Excision and Removal Internal Fixation Devices of Hip and Femur - 13 0.87 0.89 1.80 0.38 0.39   31
M Male Reproductive System
M60A S Malignancy, Male Reproductive System W CCC or SCC 1,116 1.71 2.56 1.57 0.47 –0.04 –2,814 2,416
P Newborns and Other Neonates
P60A S Neonate Died or Transf <5 Days of Adm, W/O Significant O.R. Proc, Born Here 3,014 0.29 0.63 0.52 0.47 0.24 –844 2,610
S Infectious and Parasitic Diseases [HIV]
S64B S Other HIV W/O CCC 377 1.73 1.25 2.01 0.37 0.08 –461 730
Z Factors Influencing Health Status and Other Contacts with Health Services
Z60C S Rehabilitation Sameday 919 0.14 0.31 0.18 0.71 0.10 –304 398


Table 10:
Results of selected AR-DRGs with particularly strongly increasing cost weights (5 AR-DRGs with CE > 0.25)

  . Bezeich­nung base group Split NC2 CW0 CW1 CW2 CI    CE     NegU  PosU
A Pre MDC
A05Z S Heart Transplant - 68 13.01 22.90 23.78 0.23 0.27   1,865
E Respiratory System
E72Z S Respiratory Problems Arising from Neonatal Period - 400 1.50 1.60 3.59 0.42 0.47   2,129
I Musculoskeletal System and Connective Tissue
I09A S Spinal Fusion W CCC or SCC 384 5.64 6.40 9.50 0.16 0.27   3,775
I21Z S Local Excision and Removal Internal Fixation Devices of Hip and Femur - 13 0.87 0.89 1.80 0.38 0.39   31
N Female Reproductive System
N11B S Other Female Reproductive System O.R. Procs Age<65 W/O Malignancy W/O CC 2,108 0.35 0.56 0.65 0.12 0.29   1,611

Table 11:
Results of selected AR-DRGs with particularly strongly decreasing cost weights (6 AR-DRGs with CE < –0.25)

  . Bezeich­nung base group Split NC2 CW0 CW1 CW2 CI    CE     NegU  PosU
9 Error DRGs (not groupable)
962Z S Unacceptable Obstetric Diagnosis Combination - 58 1.15 0.83 0.63 0.07 –0.30 –77  
A Pre MDC
A02Z S Multiple Organs Transplant - 14 51.92 19.55 16.37 0.50 –0.61 –1,268  
F Circulatory System
F02Z S AICD Component Implantation/Replacement - 19 14.38 12.73 7.22 0.17 –0.31 –346  
R Neoplastic Disorders (Haematological and Solid Neoplasms)
R64Z S Radiotherapy - 319 0.91 0.47 0.25 0.20 –0.61 –536  
S Infectious and Parasitic Diseases [HIV]
S60Z S HIV Sameday 983 0.46 0.34 0.24 0.03 –0.32 –551  
U Mental
U68Z S Childhood Mental Disorders - 675 3.28 2.19 1.50 0.09 –0.38 –3,060  


Table 12:
Results of selected AR-DRGs with extremely strong reductions in cost volume (4 AR-DRGs with NegU <= AUD 7,500 thousend)

  . Bezeich­nung base group Split NC2 CW0 CW1 CW2 CI    CE     NegU  PosU
9 Error DRGs (not groupable)
901Z S Extensive O.R. Procedure Unrelated to Principal Diagnosis - 6,024 3.96 3.24 3.32 0.11 –0.09 –11,047 1,227
L Kidney and Urinary Tract
L61Z S Admit for Renal Dialysis - 463,634 0.19 0.18 0.17   –0.06 –23,618  
R Neoplastic Disorders (Haematological and Solid Neoplasms)
R63Z S Chemotherapy - 114,868 0.27 0.24 0.21   –0.13 –17,554  
U Mental
U61B S Schizophrenia Disorders W/O Mental Health Legal Status 8,063 2.57 2.12 2.08 0.09 –0.11 –10,063  

Table 13:
Results of selected AR-DRGs with extremly strong increases in cost volume (6 AR-DRGs with PosU >= AUD 7,500 thousend)

  . Bezeich­nung base group Split NC2 CW0 CW1 CW2 CI    CE     NegU  PosU
A Pre MDC
A06Z S Tracheostomy Any Age, Any Condition 6,956 20.09 19.89 20.80 0.03 0.02 –3,543 16,122
I Musculoskeletal System and Connective Tissue
I03B S Hip Replacement W CCC or SCC or Hip Revision W/O CCC or SCC 4,811 4.97 5.37 5.72   0.07   9,190
I08A S Other Hip and Femur Procedures W CCC or SCC 5,917 4.09 4.33 4.76 0.02 0.08   10,097
I13C S Humerus, Tibia, Fibula and Ankle Procedures Age<60 W/O CCC or SCC 10,213 1.44 1.60 1.75   0.10   8,064
P Newborns and Other Neonates
P67D S Neonate, AdmWt> 2499 g W/O Significant O.R. Procedure W/O Problem 21,390 0.51 0.67 0.73 0.08 0.17   11,986
U Mental
U61A S Schizophrenia Disorders W Mental Health Legal Status 4,474 2.57 3.28 2.91 0.18 0.06 –4,216 8,091


|^·<×>·v|

6

Discussion


For an in-depth analysis and discussion of AR-DRGs with conspicuous CE, CI and U values, we subjected some examples to closer scrutiny.


The objective was not only an attempt to "explore" causes of changes in cost weights, but also to raise further questions in connection with possible causes of changes that had been recognised. Even though many of the possible causes are still hypothetical, they still provide food for thought about the direction that more detailed research should take.

Selected AR-DRGs

We selected the following AR-DRGs for discussion:

  • A02Z : Multiple Organs Transplant.
  • I09A : Spinal Fusion W CCC or SCC.
  • P67D : Neonate, AdmWt > 2499 g W/O Significant O.R. Procedure W/O Problem.

Table 14:
Questions concerning indiviual DRGs

Nr. Question A02Z I09A P67D
1.1 Might a part of the instability that was observed have been caused by numbers of cases that are too low? Yes No No
1.2 Is the DRG not homogeneous from a clinical point of view? (Does it cover a wide spectrum of different syndromes and/or different treatments?) Yes Yes No
1.3 Is the DRG not homogeneous from an economic point of view? (Is the estimate of the cost weight poor, i. e. is the confidence interval relatively high [higher than 5 % of the cost weight]?) Yes Yes
(ausser in 1997/98)
Yes
(ausser in 1998/99)
1.4 Were there any DRG-specific changes with regard to encoding (codes, encoding rules)? ICD-9-CM –>
ICD-10-AM
ICD-9-CM –>
ICD-10-AM
ICD-9-CM –>
ICD-10-AM
1.5 All in all, were more outpatient treatments carried out at the expense of inpatient treatments? No No Yes.
(CW is increasing, NC is decreasing, ALOS is increasing: shift [probably of unproblematical cases] into the outpatient area.)
1.6 Was a shorter stay in the hospital purchased at the price of more diagnostic and investigation work? Wurde eine verkürzte Auf­ent­halts­dauer im Spital durch Possible (1997/98) No No
1.7 Were minimally invasive techniques used more frequently? No No
1.8 Did case costs increase or decrease owing to the introduction of other new techniques and innovations? Possible Not known Not known
1.9 Were there shifts to DRGs with higher or lower CC levels with the same base DRG as a consequence of possible false financial incentives? No No
1.10 Were there fluctuations in non-personnel costs (expenses for materials, drugs and equipment) which would explain cost weight changes? Possible Possible Possible
1.11 Were there new medical directives (e. g. as a consequence of political decisions) which would explain cost weight changes in specific DRGs (for instance, changes in the diagnostics or the treatment of newborns)? Not known Not known Possible
1.12 Were certain treatment newly included in the list of health insurance coverage? Not known Not known Not known
1.13 Did lengths of stay change on account of adjustments of service provision processes? No
(but possibly in 1997/98)
No No


The study contains further questions which refer to the overall system of individual MDCs and sub-MDCs.


Once we have become aware of the extent of the variability of DRG cost weights in a certain system, we have to ask the question as to how we will be able to or should deal with these challenges:


  1. How can fluctuations of clinically not homogeneous DRGs which are defined by a great number of procedures and/or main diagnoses be cushioned? For such DRGs, is it possible to make any propositions at all about changed influences (materials, drugs, methods)? Does it make sense to make finer subdivisions (i. e. split up DRGs)?
  2. How should a hospital or a professional association react to strong fluctuations in DRGs which are provided by that hospital or professional association with proportionate high frequency?
  3. What accompanying measures will have to be taken if we intend to introduce a system which contains a certain proportion of unstable DRGs?
  4. What risks does such a system entail for a hospital?


|^·<×>·v|

7

Conclusions


The costs weights examined in this study are based on cost surveys.

The causes of the variability that has been found must be explored

A proportion of the AR-DRGs display cost weights with considerable fluctuations, increases or decreases. This study was able to provide only partial evidence of the causes of this variability and, in part, instability, and even that evidence is only by way of approximation. Requisite further studies could be based on the questionnaires drawn up in the discussion part.


The results of this study indicate that it can be difficult in DRGs which are not homogeneous from a clinical and/or economic point of view to obtain cost weights that will be stable for a number of years.


Depending on the nature of the causes of the cost fluctuations that have been discovered, solutions must be sought in the changes of the general conditions laid down by the contract parties, the provisions of services in hospitals or the design of the DRG system used.

Heightened risk with risk selection

Viewed across all the AR-DRGs, change would appear to be balanced. When these cost weights are used as prices, this means that the risk for service funders and service providers with wide ranges of risks and high numbers of cases tends to be balanced. Risk selection, however, may cause the scales to tip to one side or the other, and thus lead either to success or to bankruptcy.

The continuity of supply must be guaranteed

People responsible for classification and remuneration systems are required to guarantee a certain measure of stability for these systems. Moreover, service funders and service providers are facing the inevitable challenge of having to assume responsibility for the risks in an economically changed world; it is incumbent on politics to create and maintain a framework that is compatible with this. The application of a patient classification system which serves to attain an acceptable stability of cost weights is one of the many prerequisites for this.


|^·<×>·v|

8

REFERENCES

Fischer
DRG-Systeme
2000
Fischer W. Diagnosis Related Groups (DRGs) und verwandte Patienten­klassifi­kations­systeme. Kurzbeschreibungen und Beurteilung. Wolfertswil (ZIM) 2000: 181 pp. Internet: http:// www.fischer-zim.ch / studien / DRG-Systeme-0003-Info.htm.
Fischer
APDRG-LEP
2001
Fischer W. Homogeneity of Nursing Workload Measured by LEP Within AP-DRGs. In: Proceedings of the 17th PCS/E International Working Conference, Brugge 2001: 154–161. Internet: http:// www.fischer-zim.ch / paper-en / APDRG-LEP-USZ-0110-PCSE.htm.
Fischer et al.
CW-AR4
2002
Fischer W, Schumann M, Lenz M. Ein Vergleich der nationalen australischen Kostengewichte aus den drei Kostenrunden 1997/98 bis 1999/00. In: 3. deutsche Casemix-Konferenz, Konferenzdokumentation, Berlin 2002. Internet: http:// www.fischer-zim.ch / artikel / CW-AR4-Analyse-0203-DCK3.htm.

Z I M  -  Zentrum für Informatik und wirtschaftliche Medizin
CH-9116 Wolfertswil (SG), Steigstrasse 12, Switzerland
E-mail: , Tel: +41 71 3900 444


Previous Paper: Tables of Contents: Next Paper:
Nursing Workload and DRGs English Papers Base DRGs, Fractionation Coefficient, and Treemaps
Navigations-Tabellen
Z I M - Hauptseite

©  Z I M 
Source = http://www.fischer-zim.ch/paper-en/CW-AR4-Analysis-0210-PCSE.htm
( latest compilation: 23.11.2012 )