|
Introduction |
With regard to pediatric treatment,
there is some concern whether the DRG system in use
covers treatments adequately.
A question referring to this is:
do the expected lengths of stay calculated
from data of pediatric hospitals
correspond to the expected lengths of stay in general acute hospitals?
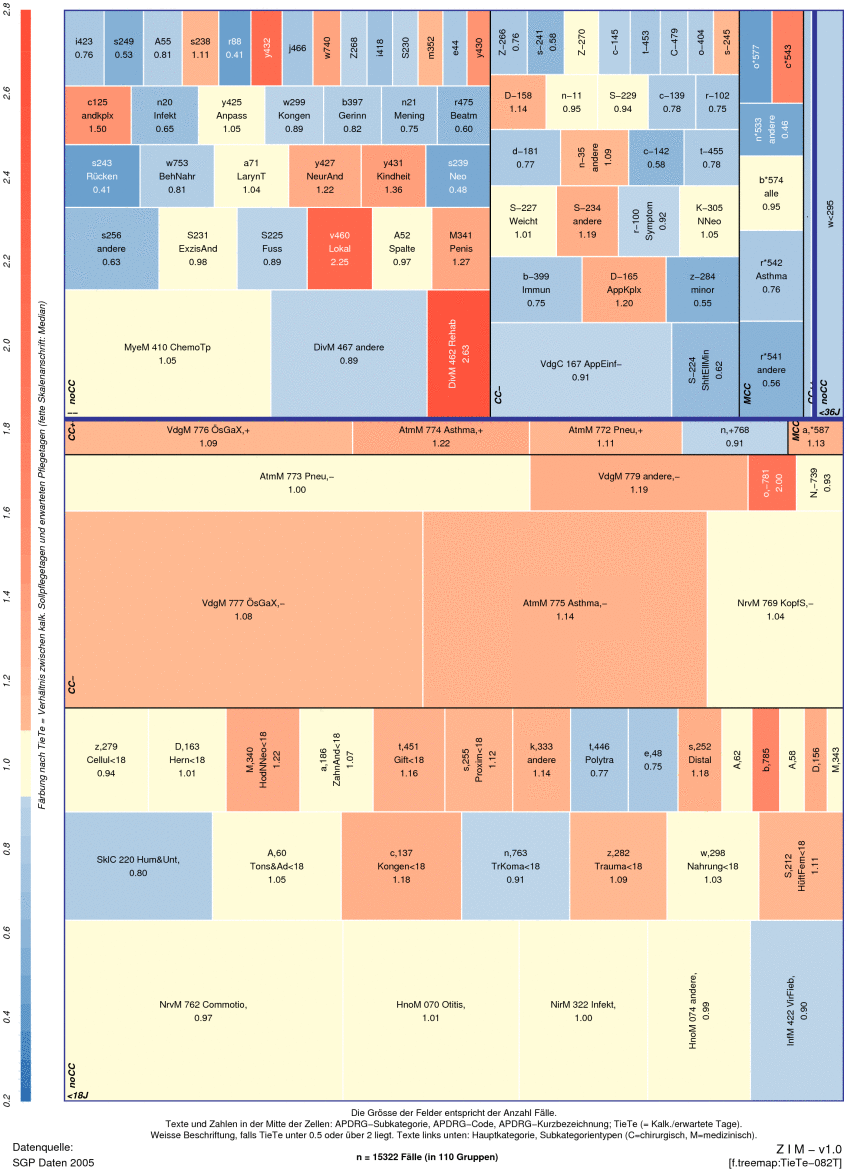
An answer could be found trough a coloured treemap. |
Table 1:
SGP 2005: Portions of cases per APDRG
|
|
|
|
Source: Fischer [Grafiken zur PCS-Beurteilung, 2008]: 83. |
|
Data |
15'322 case records of eight Swiss children\'s hospitals
(including pediatric departments of big hospitals)
from the year 2005 classified by APDRG-CH were available.
The data fields used were: length of stay by case,
and APDRG-CH expected length of stay by APDRG. |
1
Shneiderman [Treemaps, 1992].
|
Methods |
The expected length of stay for pediatric hospitals
was calculated from the data
using the same algorithms as were used for APDRG-CH.
This value [called Tie] was compared
to the expected length defined by APDRG-CH [Te].
–
A treemap1
was constructed with hierachical levels of
(1) the type of age split,
(2) the CC category,
(3) the APDRG.
The sizes of the resulting fields are proportionated
according to the number of cases within each APDRG.
They were coloured according to the relation:
Tie divided by Te.
Blue colours show that the expected length of stay
in the pediatric hospitals [Tie]
is shorter than expected for general acute hospitals [Te].
Red colours show the opposite.
Colour intensity is used to show the extent of this deviation. |
|
Results |
At first glance, one sees
that the lower and the upper parts
of the treemap show different colours:
most rectangles of the lower part are red (or yellow) and less intense,
many rectangles of the upper part are blue and more intense.
This means:
the expected length of stay of APDRGs
for patients below 18 years (lower part)
is longer in pediatric hospitals than in general hospitals;
the expected length of stay of APDRGs
without age split (or with age split above 18 years: upper parts)
is shorter in pediatric hospitals than in general hospitals. |
|
Discussion |
The differences could have been caused
either
by the specialisation of the pediatric hospitals.
(Principally, DRG systems should cover such differences of casemix;
if this were accepted for the APDRG system,
then the question would arise about the efficency of
the treatments in pediatric hospitals;
if one does not accept it for the APDRG system
then the expected length of stays should be
calculated separately for pediatric hospitals.)
Or it could also have been caused
by insufficient coding. |
|
Conclusions |
There is a striking difference in the relation of
expection length of stays in pediatric hospitals and general hospitals.
The reasons could be:
an inadequate DRG system,
inefficient treatment,
or insufficent coding. |
|
|
|
|
References |
|
- Fischer
- Grafiken zur PCS-Beurteilung
2008
| Fischer W. Statistische Grafiken zur Beurteilung von Patientenklassifikationssystemen. dargestellt am Beispiel der pädiatrischen Sicht auf das APDRG-System. Wolfertswil (ZIM) 2008: 169 pp. Internet:
http:// www.fischer-zim.ch / studien / Grafiken-PCS-Beurteilung-0804-Info.htm. |
|
- Fischer
- DRG-Familie
2008
| Fischer W. Die DRG-Familie. Stand: 2007. Wolfertswil (ZIM) 2008: 32 pp. Internet:
http:// www.fischer-zim.ch / textk-pcs / index.htm. |
|
- Shneiderman
- Treemaps
1992
| Shneiderman B. Tree visualization with tree-maps. 2-d space-filling approach. In: ACM Transactions on Graphics (TOG) 1992(11)1: 92–99. |
![[print]](../PIC/e-div/print.gif)
![[pdf icon]](../PIC/e-div/pdf.gif) pdf file
(20 KB)
pdf file
(20 KB) Grafiken zur PCS-Beurteilung
 Krankenhaus-Betriebsvergleiche
 Belegungsdiagramm